Imagine that you are running a fruit store.

Photo credit: gorosi / 123RF Stock Photo.
- You start by hiring someone to keep track of the stock level, profit and loss, top-selling fruits, and churn out reports. That’s Business Intelligence (BI), where you care about an accurate account of what happened and what’s going on in your business.
- You then hire someone to take a look at the reports and work out new marketing strategies, pricing models, and new fruits to introduce to the market. That’s Business Analysis (BA), where you care about the discovery of trends and understanding what you can improve in running the business.
- Finally, you hire someone to build an automated system to recommend baskets of mixed fruit to loyal customers, optimize the layout of fruit rack based on different metrics, and automatically set the optimal price based on market supply and demand. That’s Data Science (DS), where you care about how you can improve the business through automation and modeling of the real world.
How these work together
That’s a summary of my career so far. I started my journey at EMC generating reports to management on product usage (BI). I then worked at Khoo Teck Puat Hospital as a business analyst, building dashboards and forecasting models on my laptop (BA).
I am now working with my team at Lazada to create recommendation systems that will service millions of customers across Southeast Asia in real time. In general, as we move from BI to BA to DS, the work gets increasingly complex while the business impact increases exponentially.
While having a daily report on sales figures is critical, it is of limited use by itself. We need to have the BA skills to interpret the findings and the DS knowledge to build the necessary data products to solve the problem.
Skills needed
Kevin Schmidt accurately summarized the skill set of data scientists as such:
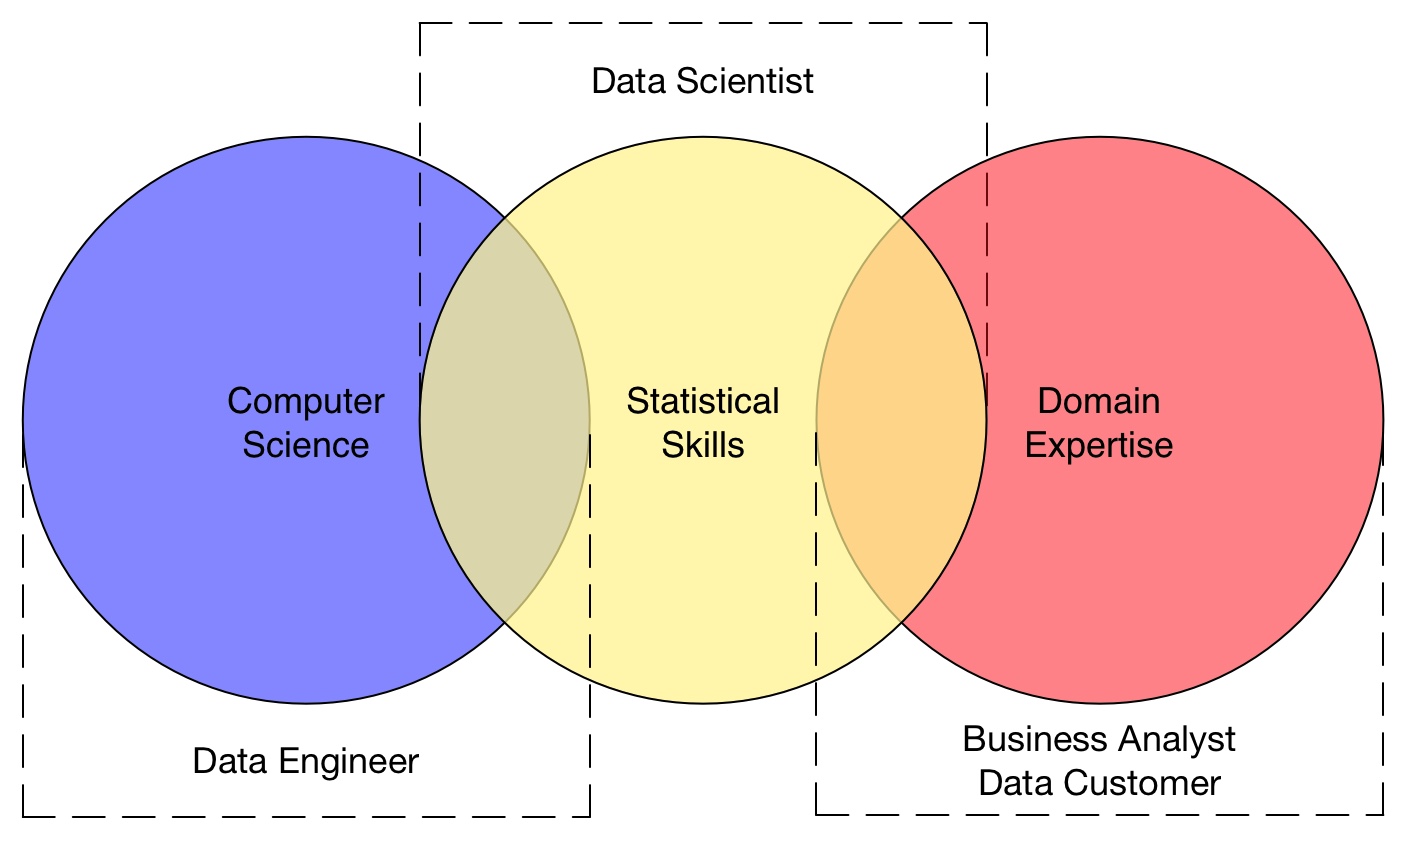
The skill set of data scientists.
In practice, I work in close collaboration with the data engineers and business analysts in Lazada. My role is to translate business intuitions of the real world into scalable statistical models that are deployable and verifiable by the data engineers. I divide my time into:
- 5% Preparing findings and talking with stakeholders
- 10% Reading papers and trying new tools
- 10% Designing data architecture
- 15% Building models
- 30% Deploying and maintaining models
- 30% Getting and cleaning data
Common misconceptions
Most data scientists come into the industry hoping to spend 100 percent of their time making cool models. Unfortunately, by the time most of us are done designing the data architecture and are starting on deploying the model, we would have filtered out most of the complex, “interesting” algorithms that couldn’t scale or was too expensive to operationalize.
A model with 80 percent accuracy that scales to millions of customers, return results in 50ms, that can be deployed and maintained cheaply is a better choice than a model with 90 percent accuracy that can’t scale affordably.
In other words, balancing all the demands and tradeoffs is as much an art as it is a science.
Interested?





Stay updated on the go with our mobile app.
Get latest insights with smoother, more personalized experience through TIA mobile app.











📅 Upcoming Events
22 October 2026
Payoneer x CSPN Summit 2026