Terence Lee · · 4 min read
Singapore’s m-commerce market jumps seven-fold to US$259M in one year
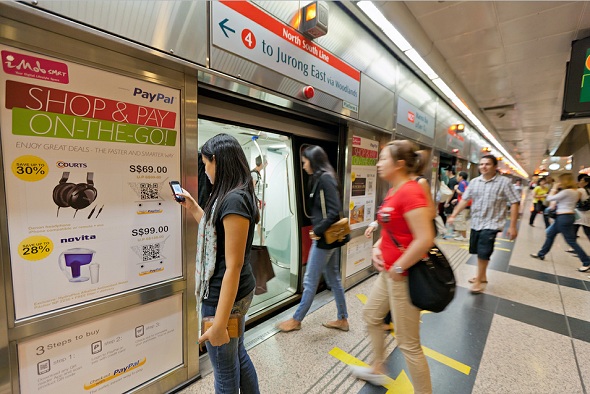
2011 has turned out to be a breakout year for mobile commerce in Singapore, says PayPal‘s Online and Mobile Shopping Insights 2011 study.
The report has revealed that the country’s mobile commerce market has grown by 660 percent reach S$328M (US$259M) last year from S4$3M (US$33M) in 2010.
The study was conducted by The Nielsen Company online using a representative sample of 1,009 Singaporean online shoppers aged 18 and above. 482 of them are mobile shoppers, which in this study means that they have shopped or made purchases using a mobile phone or tablet.
The mobile commerce market is expected to grow ten-fold to reach S$3.1B (US$2.45B) in 2015, indicating that shopping on mobile devices has become mainstream due to the ubiquity of such devices.
More findings from the study below:
General consumer behavior
- Mobile shopping comprised about a quarter (23%) of all online shopping in 2011, nearly six times its share (4%) of the online shopping market in 2010.
- Mobile shoppers constituted close to half (48%) of all online shoppers in 2011, compared to about one in three (29%) in 2010.
- The median spend per head for mobile shoppers increased from S$93 (US$73) in 2010 to S$354 (US$279) in 2011. There were 880,792 Singaporeans who made a purchase through a mobile device in 2011, compared to 364,390 in the previous year.
- The majority (75%) of purchases made using mobile devices were via smartphones.
- Singaporeans spent S$244M (US$193M) through their smartphones in 2011 – representing close to three-quarters of the total mobile commerce market – compared to S$82M (US$65) through tablets.
- The average spend per head on tablets was S$380 (US$300), significantly higher than the average spend per head on smartphones, which amounted to S$274 (US$217) suggesting a growing market and potential for mobile shopping via web-enabled tablets.
- Four out of every ten purchases on both tablets and smartphones made at home.
- The office was the next common place to shop (18% of smartphone users and 11% of tablet users).
- Mobile shopping while commuting via bus or train or in transit was yet another preferred place for transactions (13% of smartphone users and 11% of tablet users).
Top spending categories for mobile shopping
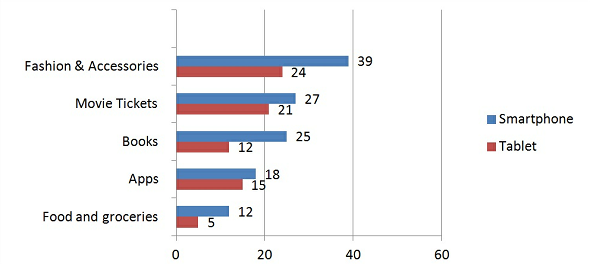
Mobile shopping is much broader than just digital downloads with ‘fashion and accessories’ and ‘movie tickets’ seen as hot favorites for both smartphone and tablet shoppers.
- Almost a quarter of mobile shoppers indicated a desire to purchase fashion items, airline and movie tickets on-the-go with their smartphones indicating there is room for growth and that retailers have the opportunity to provide multi-channel shopping experiences in these categories.
- Tablet users exhibit a different set of preferences. Tablet users indicated they would like to purchase automotive goods and computer hardware. This suggests that compared to smartphone users, tablet owners are more likely to purchase higher ticket items on their devices due to the tablet’s larger screen size.
Graph: Top Mobile Spending Categories in 2011 in S$ millions





Stay updated on the go with our mobile app.
Get latest insights with smoother, more personalized experience through TIA mobile app.