- Insights This article was written by a TIA community member. Insights pieces undergo the same rigorous editorial process that newsroom-produced articles have.
 Ragha Vasudevan · · 6 min read
4 ways to fix slow data dashboards
A common problem that data analysts and report users face is slow dashboards. Some users raise the concern, but others simply stop using such applications completely.
This sub-optimal responsiveness results in “white elephants,” which are applications that required significant effort and investment to build but have no users.
Not all dashboards have to end that way. Here are four ways their performance can be improved.
The reporting landscape
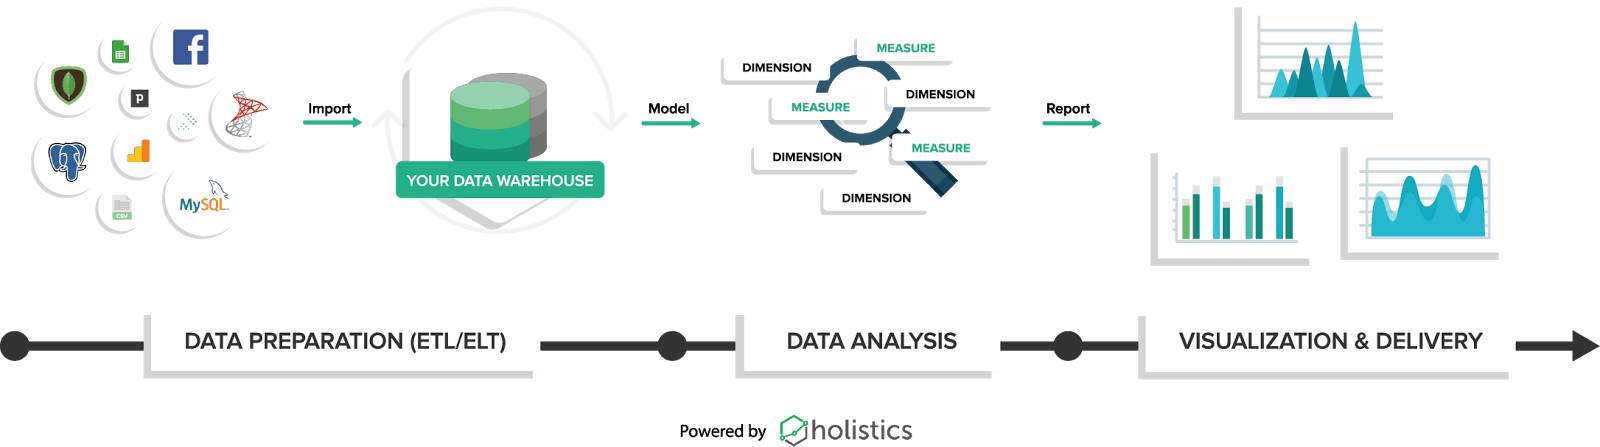
A dashboard or reporting application usually has many technical components working in tandem. When one takes an end-to-end view of a business intelligence (BI) application, performance improvement can come from four different activities:
- Improving the underlying data model
- Optimizing the individual tables in the reporting database
- Caching the report data within a BI tool
- Setting better defaults for reports and dashboards
Improving the data model
If reporting applications go against the online transactional processing (OLTP) or production database, the tables are likely to be “normalized” or optimized for the product’s performance. In order to reduce data duplication and to make information storage more efficient, data will be captured across multiple tables. However, when the same database is used for reporting, the dashboard has to traverse across so many tables to render the visualizations, slowing down the time to render.
Data warehouses or data marts typically model data using a denormalized or “flat” version of all the data points. The simplest way to understand how to model a table in a reporting context is to imagine a broad table containing many columns, encompassing data elements from several tables in the source. One best practice is to resolve IDs and other reference keys into ready-to-use English forms. Here’s an example:
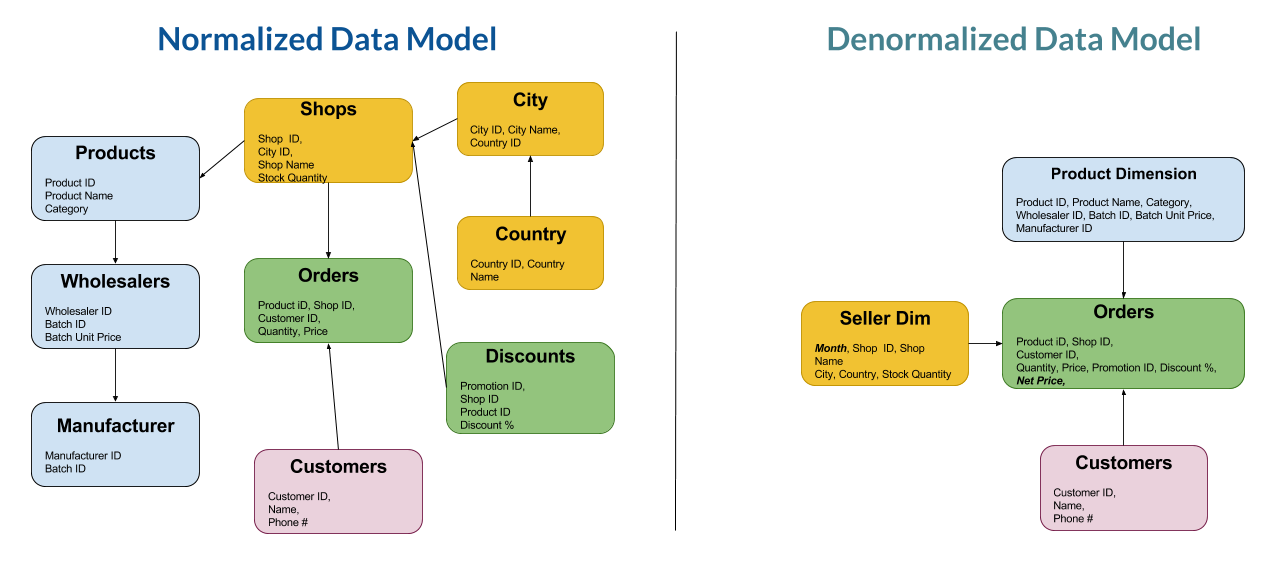
Flattening tables ensures that the query fired by the dashboard goes against one table, fetching all the required elements in one shot.
The cost of implementing a better data model is the storage cost of additional tables and the duplication of source data. In the example above, the City Name and the Country Name are repeated several times. If countries from which orders were created is identified by a numbered ID (e.g. 1, 2, and so on) in the source, the reporting table would have the full country name spelled out (e.g. United States of America, Singapore, etc.).
Conclusion





Stay updated on the go with our mobile app.
Get latest insights with smoother, more personalized experience through TIA mobile app.