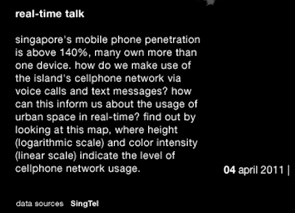
 LIVE Singapore brings real time visualizations live in Singapore. From mobile phone usage to Formula One, complex data in Singapore are presented in 6 gorgeous visualizations.
LIVE Singapore is a project developed as part of the Future Urban Mobility research initiative at the Singapore-MIT Alliance for Research and Technology (SMART). It brings together multiple digital data streams from the city and transforms them into a series of dynamic visualizations.
I particularly like the real-time mobile usage visualization. It’s a pleasant surprise to learn that Singapore’s mobile penetration is above 140 percent. I understand it’s high, but I didn’t know it is this high.
Enjoy all 6 visualizations below, showcasing different data in various scenarios in Singapore, courtesy of LIVE Singapore.
Real-Time Talk

Formula One City

Raining Taxis

Hub of the World





Stay updated on the go with our mobile app.
Get latest insights with smoother, more personalized experience through TIA mobile app.