- Insights This article was written by a TIA community member. Insights pieces undergo the same rigorous editorial process that newsroom-produced articles have.
 wei hong low · · 5 min read
The best place to rent out Airbnb units in Kuala Lumpur: A data science project
Airbnb’s gross revenue stands at US$4.3 billion. More impressively, it has 150 million users and roughly 6.4 million property listings across 191 countries.
In Southeast Asia, Malaysia continues to be the fastest-growing country for Airbnb, with a total of 53,000 listings that brought in an estimated 3 billion Malaysian ringgit (US$724 million) in direct economic impact in 2018 alone.
Knowing this, I had to ask myself, “What is the best area to start an Airbnb business in Kuala Lumpur?”
Data collection journey
Before I started to crawl the Airbnb website, I came across this article which discouraged me a little. In summary, Airbnb doesn’t make it easy for others to get their data.
The first problem I faced was the dynamically changing XPath or CSS path. This means that you can’t just use one Xpath and assume that using this on all listings would give you the same piece of information you want. The stability of the crawler was also an issue.
After spending hours inspecting the network tab, I found a path that gave me access to the JSON that contains neater data. In order to increase the stability of my crawler, I rotated IP addresses and slowed down my crawler. That allowed me to crawl data in a much stabler pace.
Data cleaning journey
After collecting the data, it was time to clean it.
First, I obtained the highest price for listings that have at least one review. Let’s call this Price A. Then, I removed all the listings that were higher than Price A (outlier listings) – listings that have a ridiculously high price, but no one has ever left a comment.
I also removed duplicate listings based on the localized neighborhood, which only left around 5,590 listings. (The estimated prices of properties for the top 10 listing areas were collected from property sites like EdgeProp, Brickz, and PropSocial.)
Data exploration
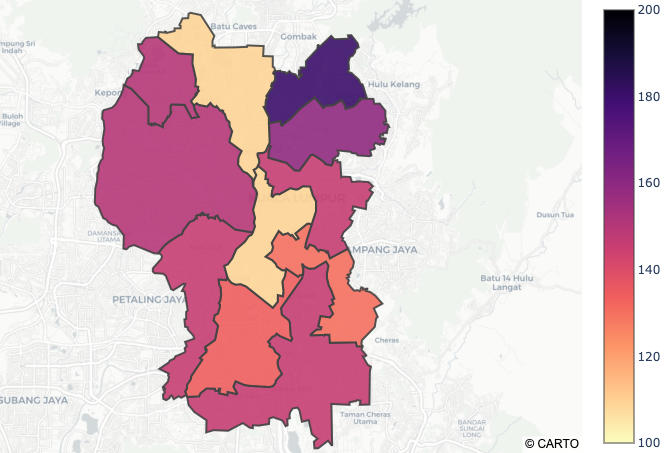
A good way to show the price distribution of Kuala Lumpur is to plot a choropleth. This map is segmented by the 11 federal constituencies of Kuala Lumpur. From the figure above, you can see that the northeast part of Malaysia has the highest average price while the central part has fairly competitive prices.
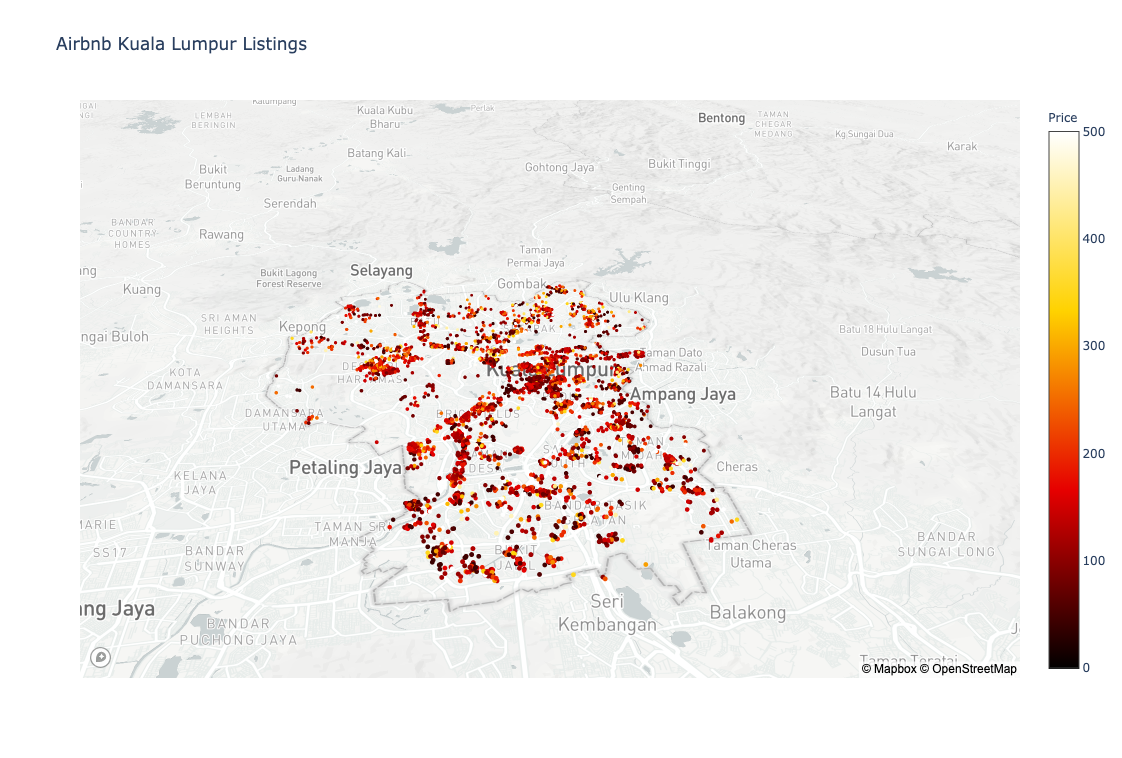
Taking a bird’s-eye view of the listings distribution across Kuala Lumpur, you can see that most of the Airbnb listings are accumulated in the city center. That’s why the prices for those listings are lower.
Data analysis





Stay updated on the go with our mobile app.
Get latest insights with smoother, more personalized experience through TIA mobile app.