
For anyone interested in the Japanese mobile market, the figures from the Telecommunications Carriers Association website are a great resource. Interestingly, the monthly mobile subscriber figures go all the way back to 1996. That’s more than 15 years of data!
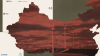
I thought it would be interesting to collect the figures from each carrier, and present it all together as an animation over time, spanning 1996 to 2012. In the chart below you can see that NTT Docomo has been the dominant carrier throughout, with challengers au and Softbank rising to prominence over the past six years or so [1].
You can begin the animation below by pressing ‘play’ on the left. All data is from TCA with subscribers measured in the thousands. If you’d like to re-use what I’ve collected, it’s available here.
-
Note that TCA does not have any eMobile data available after December 2011. ↩





Stay updated on the go with our mobile app.
Get latest insights with smoother, more personalized experience through TIA mobile app.












📅 Upcoming Events
22 October 2026
Payoneer x CSPN Summit 2026